Lab 4: Debugging in the Linux Kernel
In this lab, you will familiarise yourself with the kernel debugging tool kgdb through examples of buggy modules. You will also come back to the proper use of linked lists in the kernel.
Task 1: Connecting the kgdb debugger
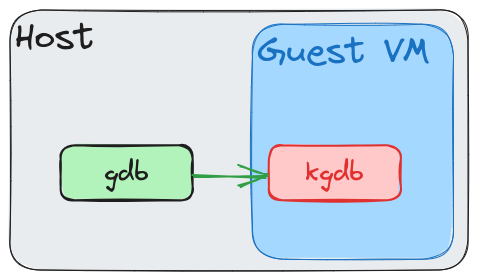
The Linux kernel embeds a debugger that can be accessed through various interfaces. One of them, kgdb, allows users to debug the kernel from a different machine (e.g., the host machine in our virtualised setup) using gdb.
From now on, you will run gdb on the host machine, connect it to the Linux kernel running in the guest VM, and use it to debug kernel code.
Question 1
Using one of the configuration tools of the kernel (e.g., make menuconfig, etc), check that kgdb and kdb are enabled, and enable them if they are not.
Most of the configuration options we will use in this lab are located in the Kernel hacking section. You should also use the search function to find where some options are located as well as their dependencies.
Question 2
When the kernel crashes, kgdb is triggered in the VM, which enables users to connect to it with gdb. To do so, you need to configure which serial port kgdb should use to connect with gdb. Furthermore, this serial port needs to be accessible from the host machine, which is made possible by QEMU by exporting a serial port to a file, a socket, etc.
Open the qemu-run-externKernel.sh script and figure out how the serial port for kgdb is exported.
If you are using an Apple device with an ARM CPU (e.g., M1), the configuration will differ a bit. Please check this tutorial written by a former student to help you set things up.
Question 3
The kernel command line option kgdbwait makes the kernel pause during the boot process to wait for a debugger to connect to it. Use this option (check out the qemu-run-externKernel.sh script) and start a VM. Start gdb on your host machine, using the vmlinux binary available at the root of your kernel directory. Finally, when the VM is paused, connect gdb to your guest kernel with the command target remote and the serial port exported in your QEMU script.
Question 4
In kgdb, what is the difference between the commands info thread and monitor ps? Use the commands help and monitor help in gdb to figure it out.
Question 5
What does the continue command do?
Question 6
You can give control back to kgdb without the kernel crashing or pausing on purpose with a Magic SysRq Key. First, make sure your kernel is compiled with the option CONFIG_MAGIC_SYSRQ enabled.
To interrupt the VM and allow kgdb to take control, you can use the combination of keys Alt+SysRq+g, or simulate this by writing ‘g’ in the /proc/sysrq-trigger file.
The Magic SysRq Key mechanism offer powerful features that may simplify debugging. You can find all these features on the Magic SysRq key Wikipedia page.
If you figure out which key corresponds to the SysRq key on your keyboard, you should avoid using it! It may be intercepted by your host and interrupt it instead of the VM! You should use the file in /proc.
Task 2: Using kgdb
Question 1
The global structure init_uts_ns stores the information returned by uname -r. In the kernel source, find where this structure is defined and initialised, and check its members.
Question 2
Using the print and set variable commands in gdb, display the content of the structure and modify it so that uname -r returns another name.
Task 3: My first bug
Now, we provide two modules, bugged on purpose. The goal of this task is not to find the bugs by analysing the code but by using kgdb instead.
Download the sources for this lab.
Question 1
Check out the sources of the module hanging and explain its behaviour.
Question 2
Compile the hanging module for your guest kernel, copy it into your VM (with the shared directory, ssh or in the home disk image), and load it in the VM. Wait for a while (~30 seconds). What happens? Does your kernel crash?
Analyse the output of the message printed in the console.
Question 3
In order to trigger kgdb when the message appears, modify the configuration of your kernel to trigger a panic in that case. Recompile your kernel and module, and load it.
Question 4
In gdb, dump the backtrace (with the backtrace command, or bt) when the panic happens. Does it match the code of your module?
Question 5
Use the commands monitor ps and monitor btp to dump the backtrace of the module correctly.
Question 6
In kgdb, check that your module is properly loaded with monitor lsmod. The first address displayed is the address of the struct module of the module. What is the second address?
Question 7
How can you solve the bug? Propose two solutions:
- one that modifies only the code of the module without changing the duration of the hanging (the
schedule_timeout()parameter); - one that only modifies the configuration of the kernel.
Task 4: Dynamic debug printing
The kernel provides dynamic debugging that allows to dynamically enable/disable the debug prints at run time (printk() with KERN_DEBUG or pr_debug()). This is a great tool if you want a large number of debug prints without always impacting the performance of your code (yes, printing is costly).
In the kernel sources at Documentation/admin-guide/dynamic-debug-howto.rst
Question 1
The module prdebug provided periodically prints the number of interrupts received by core 0.
Check out the sources of the module and try to understand its behaviour. Compile it and test it. Why aren’t there any prints in the kernel logs?
Question 2
The file /sys/kernel/debug/dynamic_debug/control allows you to configure the behaviour of dynamic printing.
Load the prdebug module into the VM and enable the prints generated by the module with the following command:
echo -n 'module prdebug +p' > /sys/kernel/debug/dynamic_debug/controlExplain this command with the help of the documentation.
Question 3
You can dynamically add information to your debug prints, such as the name of the module, the function or the line number of the call to pr_debug().
Add these information to your debug prints by sending a command to the control file used in the previous question.
Question 4
You can also apply filters and only show some pr_debug() of your module, e.g., only the print on line 16.
Unload and reload your module in the VM. Check that the dynamic debugging configuration has been reset.
With the help of the documentation, enable only the message that shows the number of received interrupts.
Task 5: Debugging a module
In this task, multiple bugs have been introduced in the provided module kcpustat. The goal of this task is to detect, analyse and fix these bugs with debugging options of the kernel and kgdb.
Do not modify the sources of the provided module if not explicitly asked to.
Question 1
The module kcpustat collects CPU usage statistics (like the command time) and displays them in the kernel logs.
Check out the sources of the module and try to understand how it works.
Question 2
Compile the module and load it in the VM. Wait for a few seconds. What happens?
Question 3
Connect gdb to your VM and check the results of backtrace and monitor btp. The result is hard to exploit…
With the commands monitor lsmod and add-symbol-file, load the symbols of the module (the .o file) at its load address.
Question 4
Which line of the module’s code triggers the fault? Fix the bug without deleting the faulty line of code.
Question 5
Try your fixed module. What happens? Again, connect gdb to figure out which data structure causes the problem.
Question 6
The kernel has options to help debug some data structures, which can be enabled in the kernel configuration. Enable this option for the data structure you want to debug.
You should now have new information in the kernel console when the bug happens. What do you deduce from this information?
Propose a fix for the bug.
Question 7
The module also doesn’t properly manage its memory. The kernel provides a memory leak detector that you can enable in the kernel configuration.
Enable it and read its documentation.
Question 8
Use the kernel memory leak detector to find where these leaks happen and fix them.